
How to estimate your conference’s carbon footprint
Conferences worldwide are only starting to investigate their carbon footprint: this guide is largely inspired from the footprint computation of the AGU 2019 Fall Meeting, but completed with more general instructions and some computer science details.
Step 1: Getting travel information
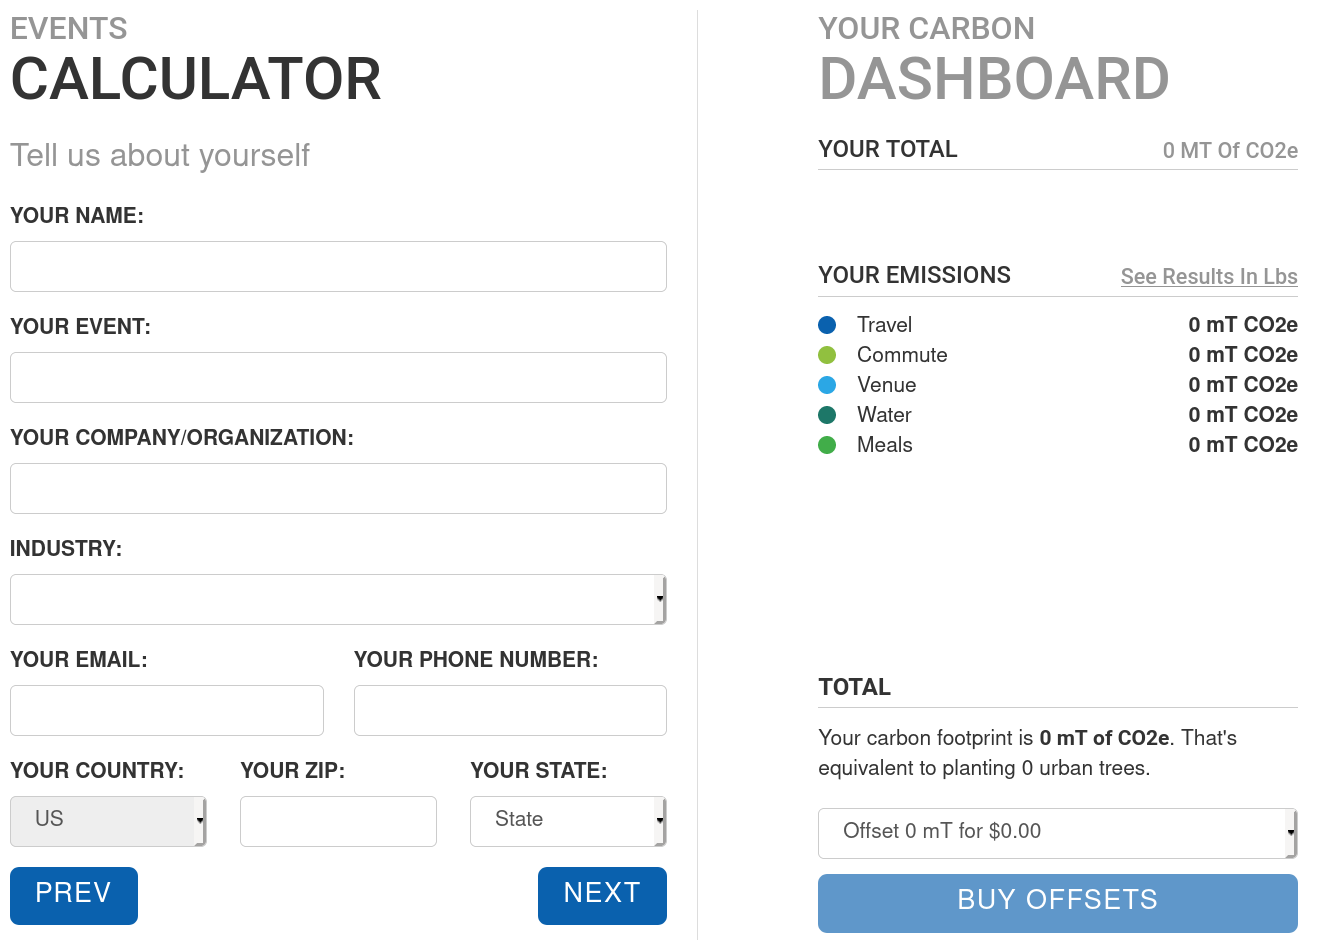
To estimate the total carbon footprint of attendees traveling to the conference, the simplest way is to ask them about their travel plans. This can be done onsite during the event, or beforehand during online registration.
If you want to collect data during the event, you can do it either at the welcome desk (when participants check in), on by circulating sheets during the conference itself. This is the most flexible option, and also makes it easier to explain to participants why you are collecting the data. The drawback is that the data needs to be re-typed in a usable form afterwards: this can be tedious and complicated to coordinate for a large event.
A simpler solution (but which requires some advance planning) is to make travels details part of the online registration form filled by all participants. This does not work if people register before deciding on their travel plans, but otherwise requires less effort.
Which information should you ask about? Ideally, you would want all details, for the forward and backward leg: where will they be leaving from and going to, by which transportation means, and even by which itinerary (e.g., direct and indirect flights do not have the same impact). But of course, getting a complete picture is impossible: people routinely do multimodal and multi-purpose trips (combining conferences, visits, tourism), so you have to set the bar at some level of detail.
Of course, specifying the origin and destination requires attendees to indicate a place, which is inconvenient to do unambiguously, both on paper or on a computer. If you have control over the online registration form, you will need to insert a form field with a Javascript widget doing some sort of geocoding to allow participants to select a known place. You can do so using Google Place Autocomplete or alternatively Algolia Places or other self-hostable open-source solutions based on OpenStreetMap: see this list.

If this is too complicated, consider simply asking participants for the name of a country in a drop-down list and a city name in free text, or simply asking for their business address, then filling in the missing details as explained below.
Step 2: Filling in the picture with some guesswork
If you couldn’t ask participants to give their travel information, or you could not ask for all the details you wanted, then you’ll need to do some guessing.
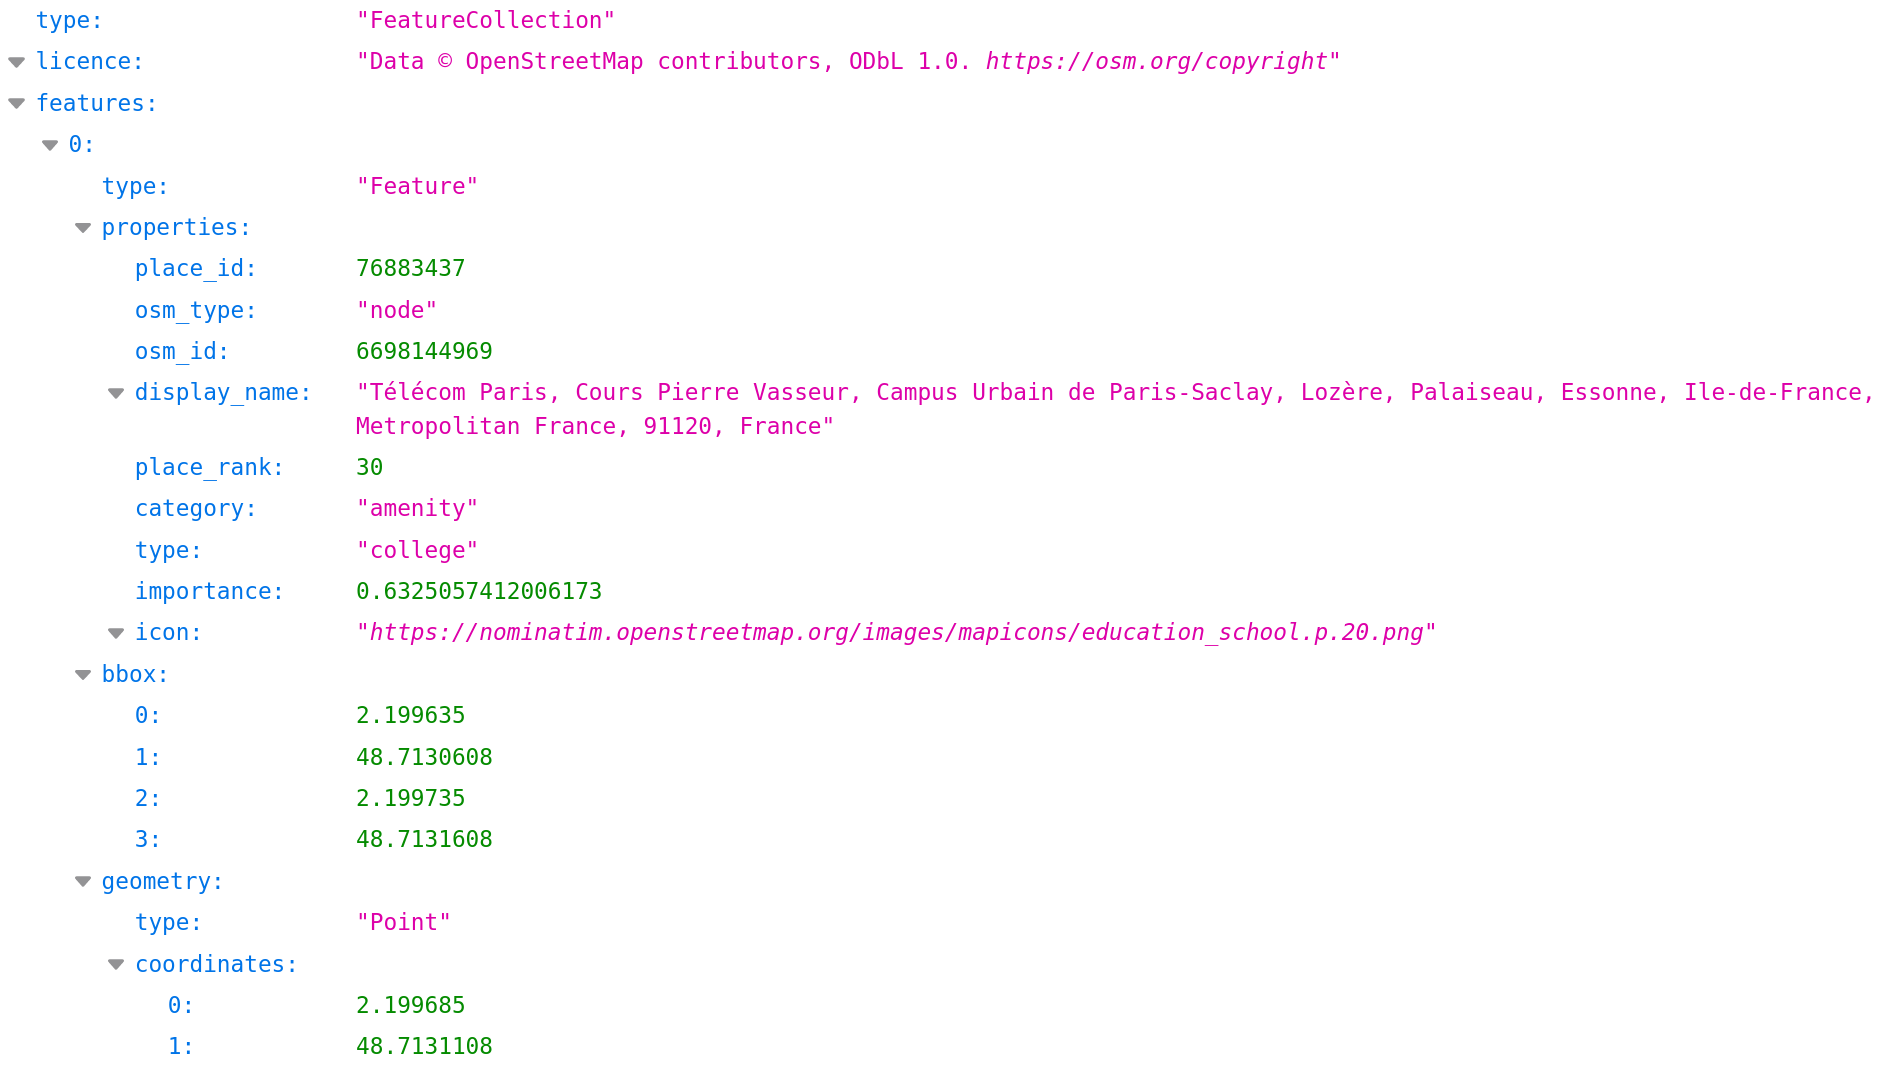
First, location. If you do not have travel details, the simplest is to assume that people will travel to and from their home institution. If you have their business address, you could use this, again with a geocoding API on the data that you have. This can for instance be done with the Nominatim API on OpenStreetMap data. Here are examples of how to use the API for a structured query using the street address of the Télécom Paris engineering school, and how to retrieve results which include a latitude and longitude: interactive example and example in JSON. The documentation of the API is here.
If you do not have a full address, you can still get results with a country and city, or just a country. In the former case, you can get coordinates for the city with Nominatim. In the latter case, you can avoid the need fer geocoding by simply using a dataset of coordinates for all countries. Of course, this is very imprecise, but it is better than nothing. For plane travel, you can also ask participants for an airport code, which allows you to find the coordinates.
Another idea is to use participant affiliations: these are often specified for badges, and can be used to do an unstructured search by name. Here is an example, again with Nominatim. Taking the first result of such unstructured queries will often work, although you may have some problem dealing with ambiguity of some place names, people indicating multiple affiliations, or employers (e.g., CNRS) that can correspond to multiple physical sites.
There may be some room for improvement here by trying to split in multiple affiliations, trying to filter API results to select only entities of a reasonable type (at least OSM universities and variants?), and maybe bringing in additional data sources such as Wikidata’s dataset of educational organizations.
All in all, it’s an interesting data integration problem!
Of course, if you have no information whatsoever about your attendees’ whereabouts, you can always do a crude estimate by multiplying the number of attendees with your best guess of an average travel distance.
Second, transportation modes. If you do not have this information, you can simply use some rules of thumb. In the AGU footprint computation, they assumed plane travel for trips over 400km, and rail/car/bus travel otherwise. The drawback of such estimations is that they are imprecise, and does not reveal possible efforts by your climate-conscious attendees to avoid plane travel even for longer distances. But again, that’s better than nothing.
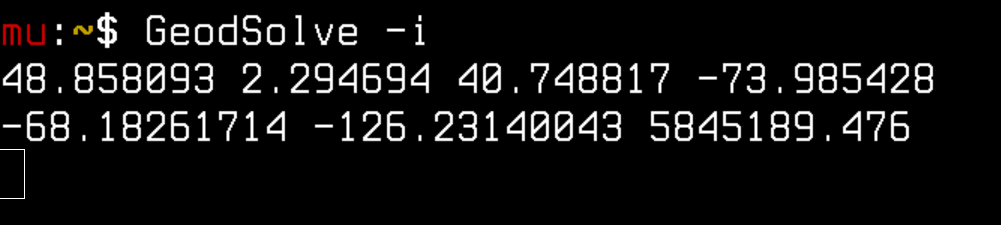
At the end of this step, you should have, for each attendee, a onward and return journey with start and end geographical coordinates and a transportation mode. The (straight-line) distance for each journey can be computed programmatically from the coordinate pairs, e.g., using the GeodSolve -i from the geographiclib-tools package on Debian.
Step 3: Computing the CO2 footprint of trips
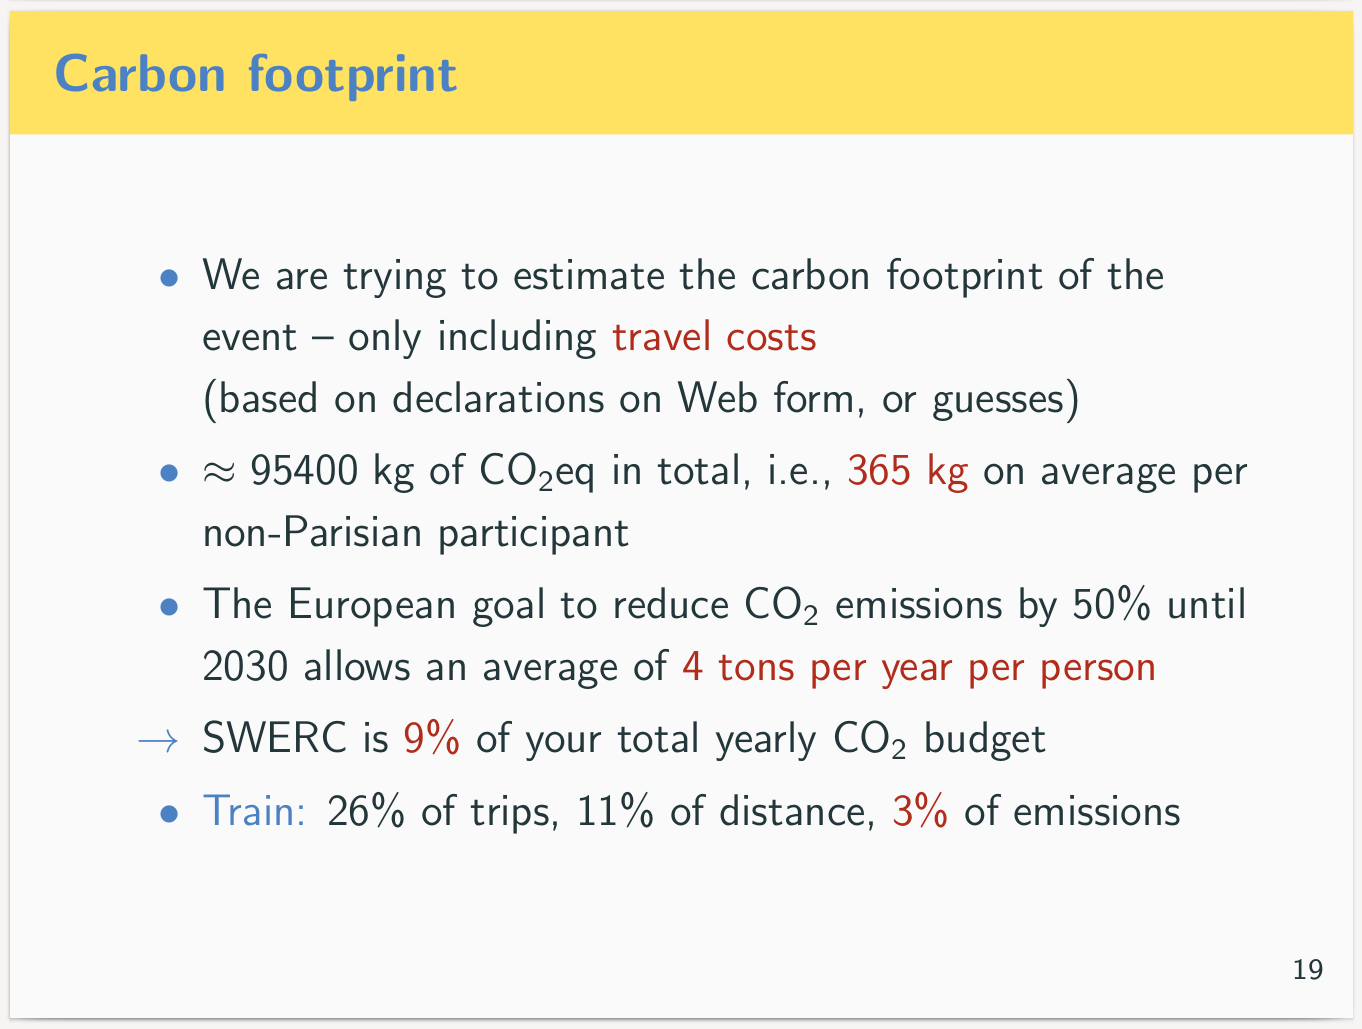
We now need to compute the CO2 footprint of each trip, based on its distance and transportation mode. Here, I again follow the the AGU footprint computation, which assumes emissions of 60g CO2eq per passenger-kilometer for rail, bus/coach, and car; and 200-300g CO2eq per passenger-kilometer for flights depending on the distance. In Europe, the 60g CO2eq per passenger-kilometer figure could be made somewhat lower for long-distance buses (e.g., 32g CO2eq per passenger-kilometer from page 7 of this report) and much lower for high-speed trains (12g CO2eq per passenger-kilometer from the same source). As for flights, there are considerable difference between estimators: see this comparison tool for details; the 200-300g figure is in the higher range of estimates.
Note that these values are equivalent CO2 masses, and do not correspond to actual CO2 emissions. The reason is that plane travel, in addition to its raw effects of releasing CO2, also contributes to global warming by releasing other substances including nitrogen oxides and water vapor, and releasing them at high altitudes: see some details here. For this reason, the environmental footprint of plane trips is usually expressed as an equivalent mass of conventional CO2 emissions.
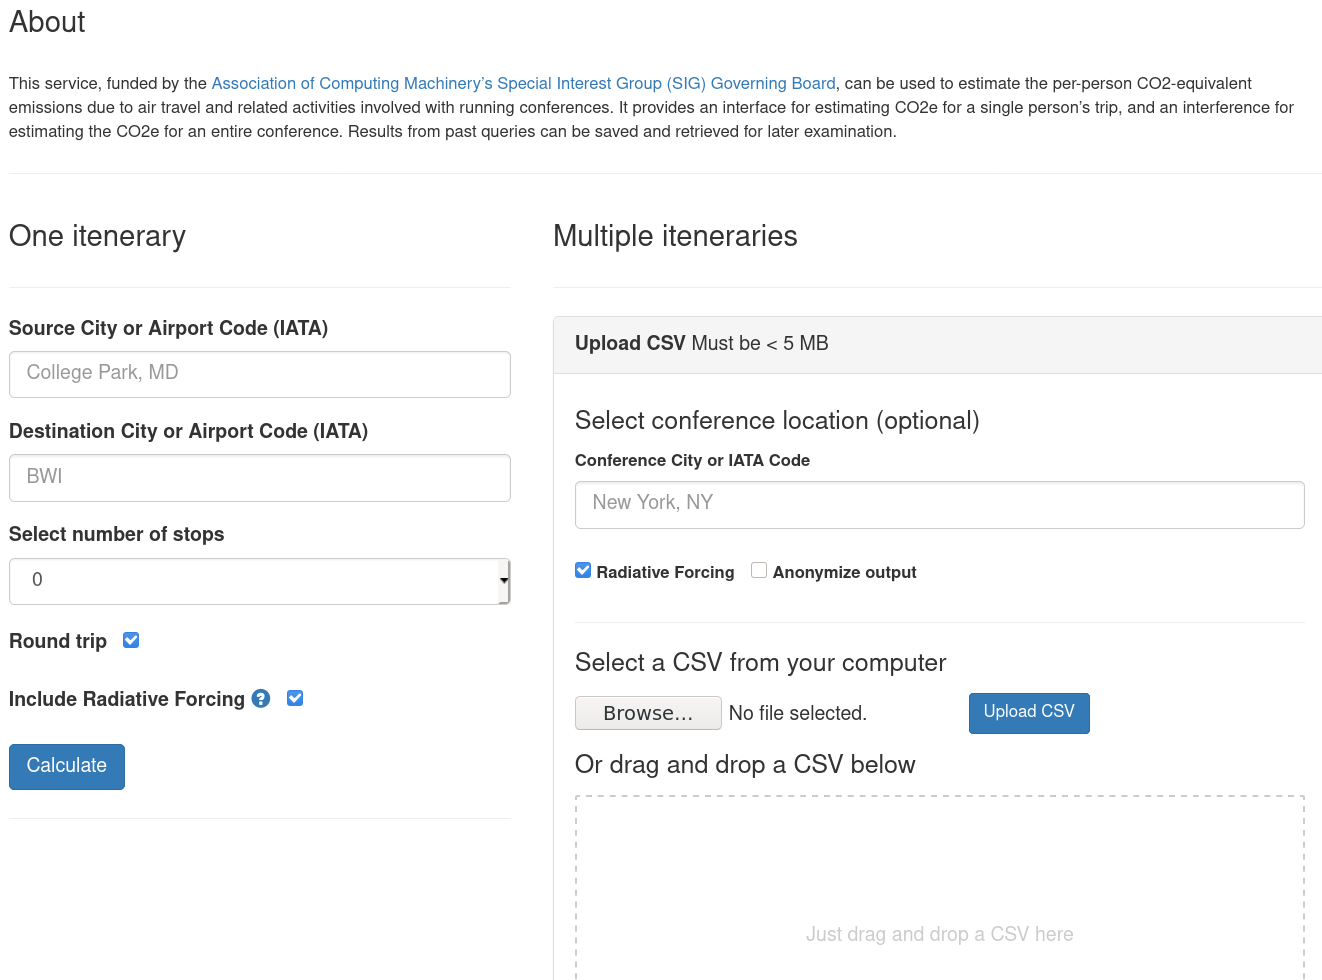
This part of the process can be performed automatically by the ACM CO2 calculator: it only covers plane travel (but covers stopovers), works at the level of cities, and is only accessible after logging in with a Google account).
Step 4: Other points to consider
Of course, the carbon footprint of your event is not limited to attendee travel, and can include many other things: electricity and heating of the conference venue, food production and transport, disposable items including conference booklets, dishware, water bottles and cups, and supplies such as badges, onsite transportation, etc. To estimate crudely the impact of all this, you can use the Terrapass Events Calculator. As a rule of thumb, however, for an international conference, you should expect that the vast majority of your carbon footprint will be travel, in particular flights.
Step 5: Using the data
The first thing that you should do with the data is of course to share it with conference attendees. The best place to do this is the conference itself, if you have computed the footprint before the event. You can report the total (equivalent) CO2 mass emitted for the conference, what it amounts to per participant on average, and the comparison with previous years if you have the data.
It also helps to put these values into perspective by comparing them to more familiar quantities, e.g., the emissions for some number of kilometers traveled by car. Alternatively, you can connect the per-participant figure with estimates of a total lifetime carbon budget pursuant to some international objectives of climate change mitigation, for instance 200 tons of CO2 per person: but you should insist that this is a lifetime estimates covering all activities of life (not just participating to conferences!). You can also convert CO2 masses to money using the current price of carbon offsets (around $25 per ton as of 2020), but keeping in mind that current offsetting costs are likely to be highly underestimated as most emitted CO2 is not currently compensated.
Beyond the immediate audience of the event, it is a good idea to post carbon footprint information on the conference website, e.g., as part of a blogpost or report presenting how the conference was run. This ensures that the information is available to everyone interested, for instance to researchers aggregating the carbon footprint of scientific conferences. This also makes it possible to compare numbers from one year to another, in which case you should make sure to also release the detailed methodology.
In fact, it can be relevant to publish the entire dataset of trips, probably suitably anonymized in case the list of attendees to your event is not public information. This dataset can be useful for more ambitious investigations, e.g., to try estimating how the carbon footprint of your conference depends on the place where it is held.