
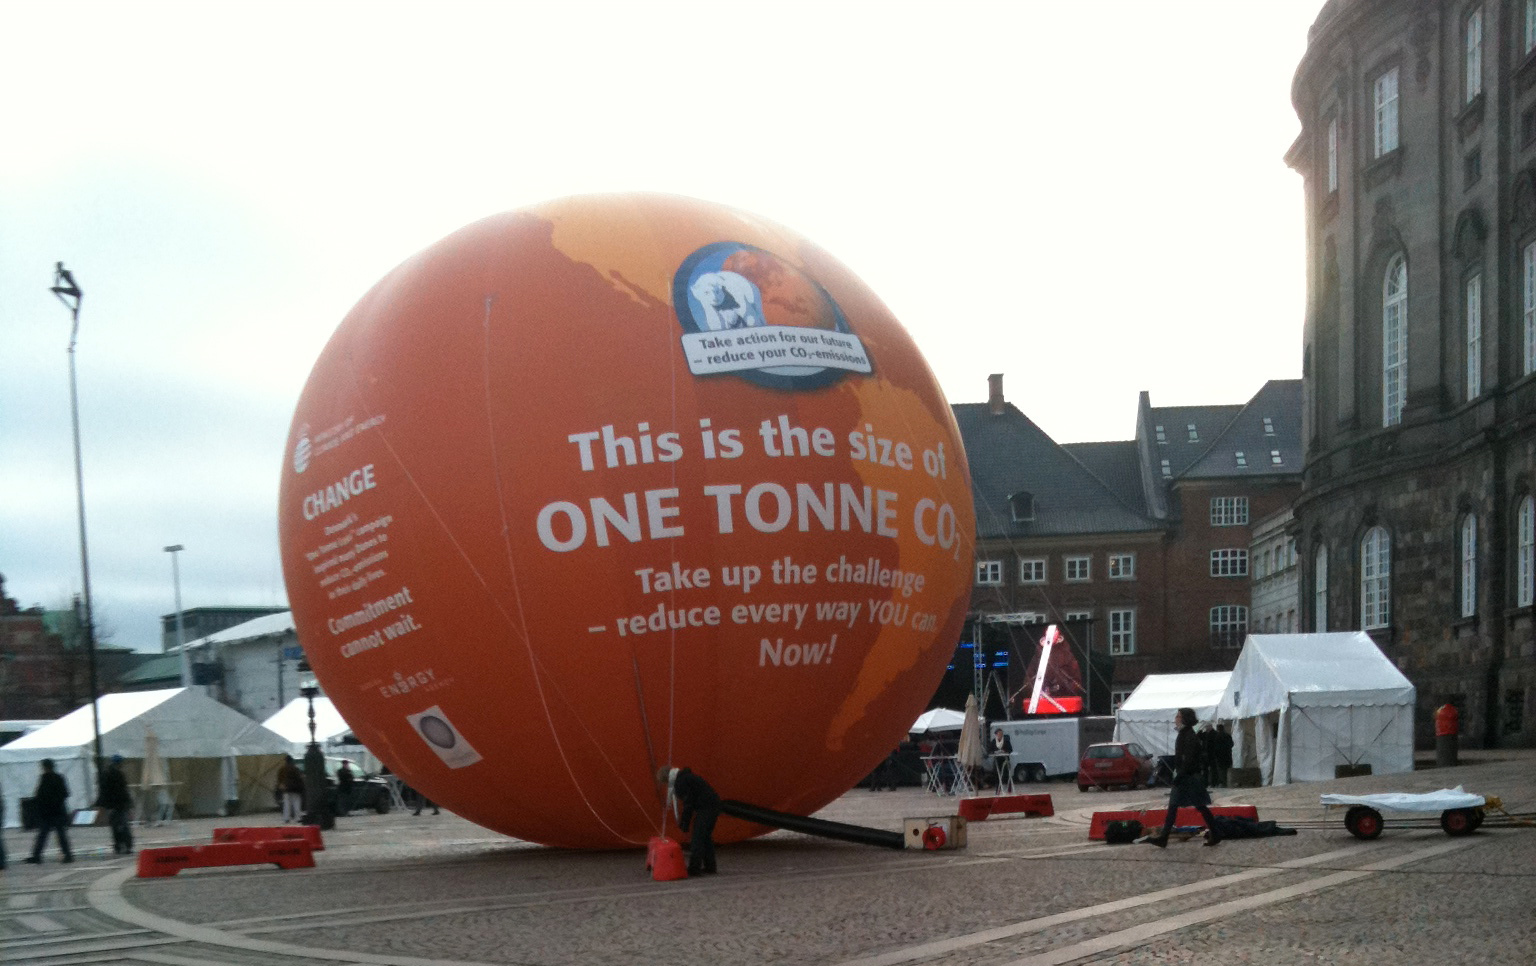
Estimating carbon footprints: what is 1 ton of CO2e?
In 2016, the world emitted around 50 gigatons of CO2e (see details at ClimateWatch). However, according to the IPCC, to limit global warming to 1.5°C, this number needs to get to around 25 gigatons by 2030 (45% reduction from 2010 levels), and reach net zero around 2050. The 2030 world emissions target of 25 gigatons of CO2e per year, if evenly distributed between the Earth’s 7.8 billion people, would amount to around 3.2 tons of CO2e per person and per year. This is a big simplification, as most of the world’s carbon emissions cannot be neatly divided between individual people; but it gives an idea of the order of magnitude. This figure also does not cover the complex political question of how these emissions should be divided among people.
So how far will these tons of CO2e get you? I’ll give examples from various activities having a significant footprint. Of course, these figures are always estimates, and necessarily imprecise: they often come with significant uncertainty, disagreement between sources, differences depending on the method of computation. Please do not use them for anything important! The point of these calculations is to estimate orders of magnitude, not exact values, like the famous numbers everyone should know in computing. The goal is to identify the leading factors in your footprint and optimize those, as it’s too easy otherwise to get sidetracked into optimizing things that are in fact negligible.
Transportation
Emitting one ton of CO2e, according to the statistics from a previous post, means:
- Travelling 80,000 km by high-speed train, or around 320 hours assuming 250 km/h
- Travelling 30,000 km by long-distance bus, or about 430 hours assuming 70 km/h
- Travelling 17,000 km by regional train, or about 240 hours assuming 70 km/h
- Travelling 8,000 km by car (on your own), or around 80 hours assuming 100 km/h
- Travelling 4,000 km by plane, or around 4h30 assuming 900 km/h (cruise speed)
For occasional trips, it may help translating these quantities to the frequency of trips. You will emit one ton of CO2e if you:
- Do a one-hour return plane trip (i.e., two hours total) every 6 months for one year. For longer trips, one ton of CO2e allows you:
- One transatlantic round trip between Amsterdam and New York every three years
- One round trip between New York and Singapore every 7.5 years
- Do a one-hour return train or long-distance bus trip every other day for one year
- Do a one-hour return car trip every 10 days for one year
- Alternatively, traveling 30 km every working day for one year (assuming 250 working days per year)
Commuting by public transportation (or by bike or by foot) instead of by car allows you to reduce your carbon emissions, because the footprint of public transportation is rather small. For instance, one ton of CO2e corresponds to travelling 394,000 km in the Parisian subway according to these statistics. That’s going 10 times around the world; or alternatively travelling 10 km by subway per day, every single day, for 80 years.
Food
Food production is another leading cause of greenhouse gas emissions. From a 2014 UK study, and assuming a standard 2,000 kcal daily diet:
- Eating vegan for one year emits one ton of CO2e
- Eating a vegetarian diet for one year emits 1.4 ton of CO2e
- Eating a medium meat diet for one year (50-100g of meat by day) emits two tons of CO2e
Of course, at a collective level, these choices add up. If you hold a 4-day event for 150 people and serve vegetarian food instead of meat, you will save one ton of CO2e, just like that, based on these statistics. (Of course, that’s just a rough estimate, as catering may not have the same footprint as regular meals, e.g., because of disposable dishware.)
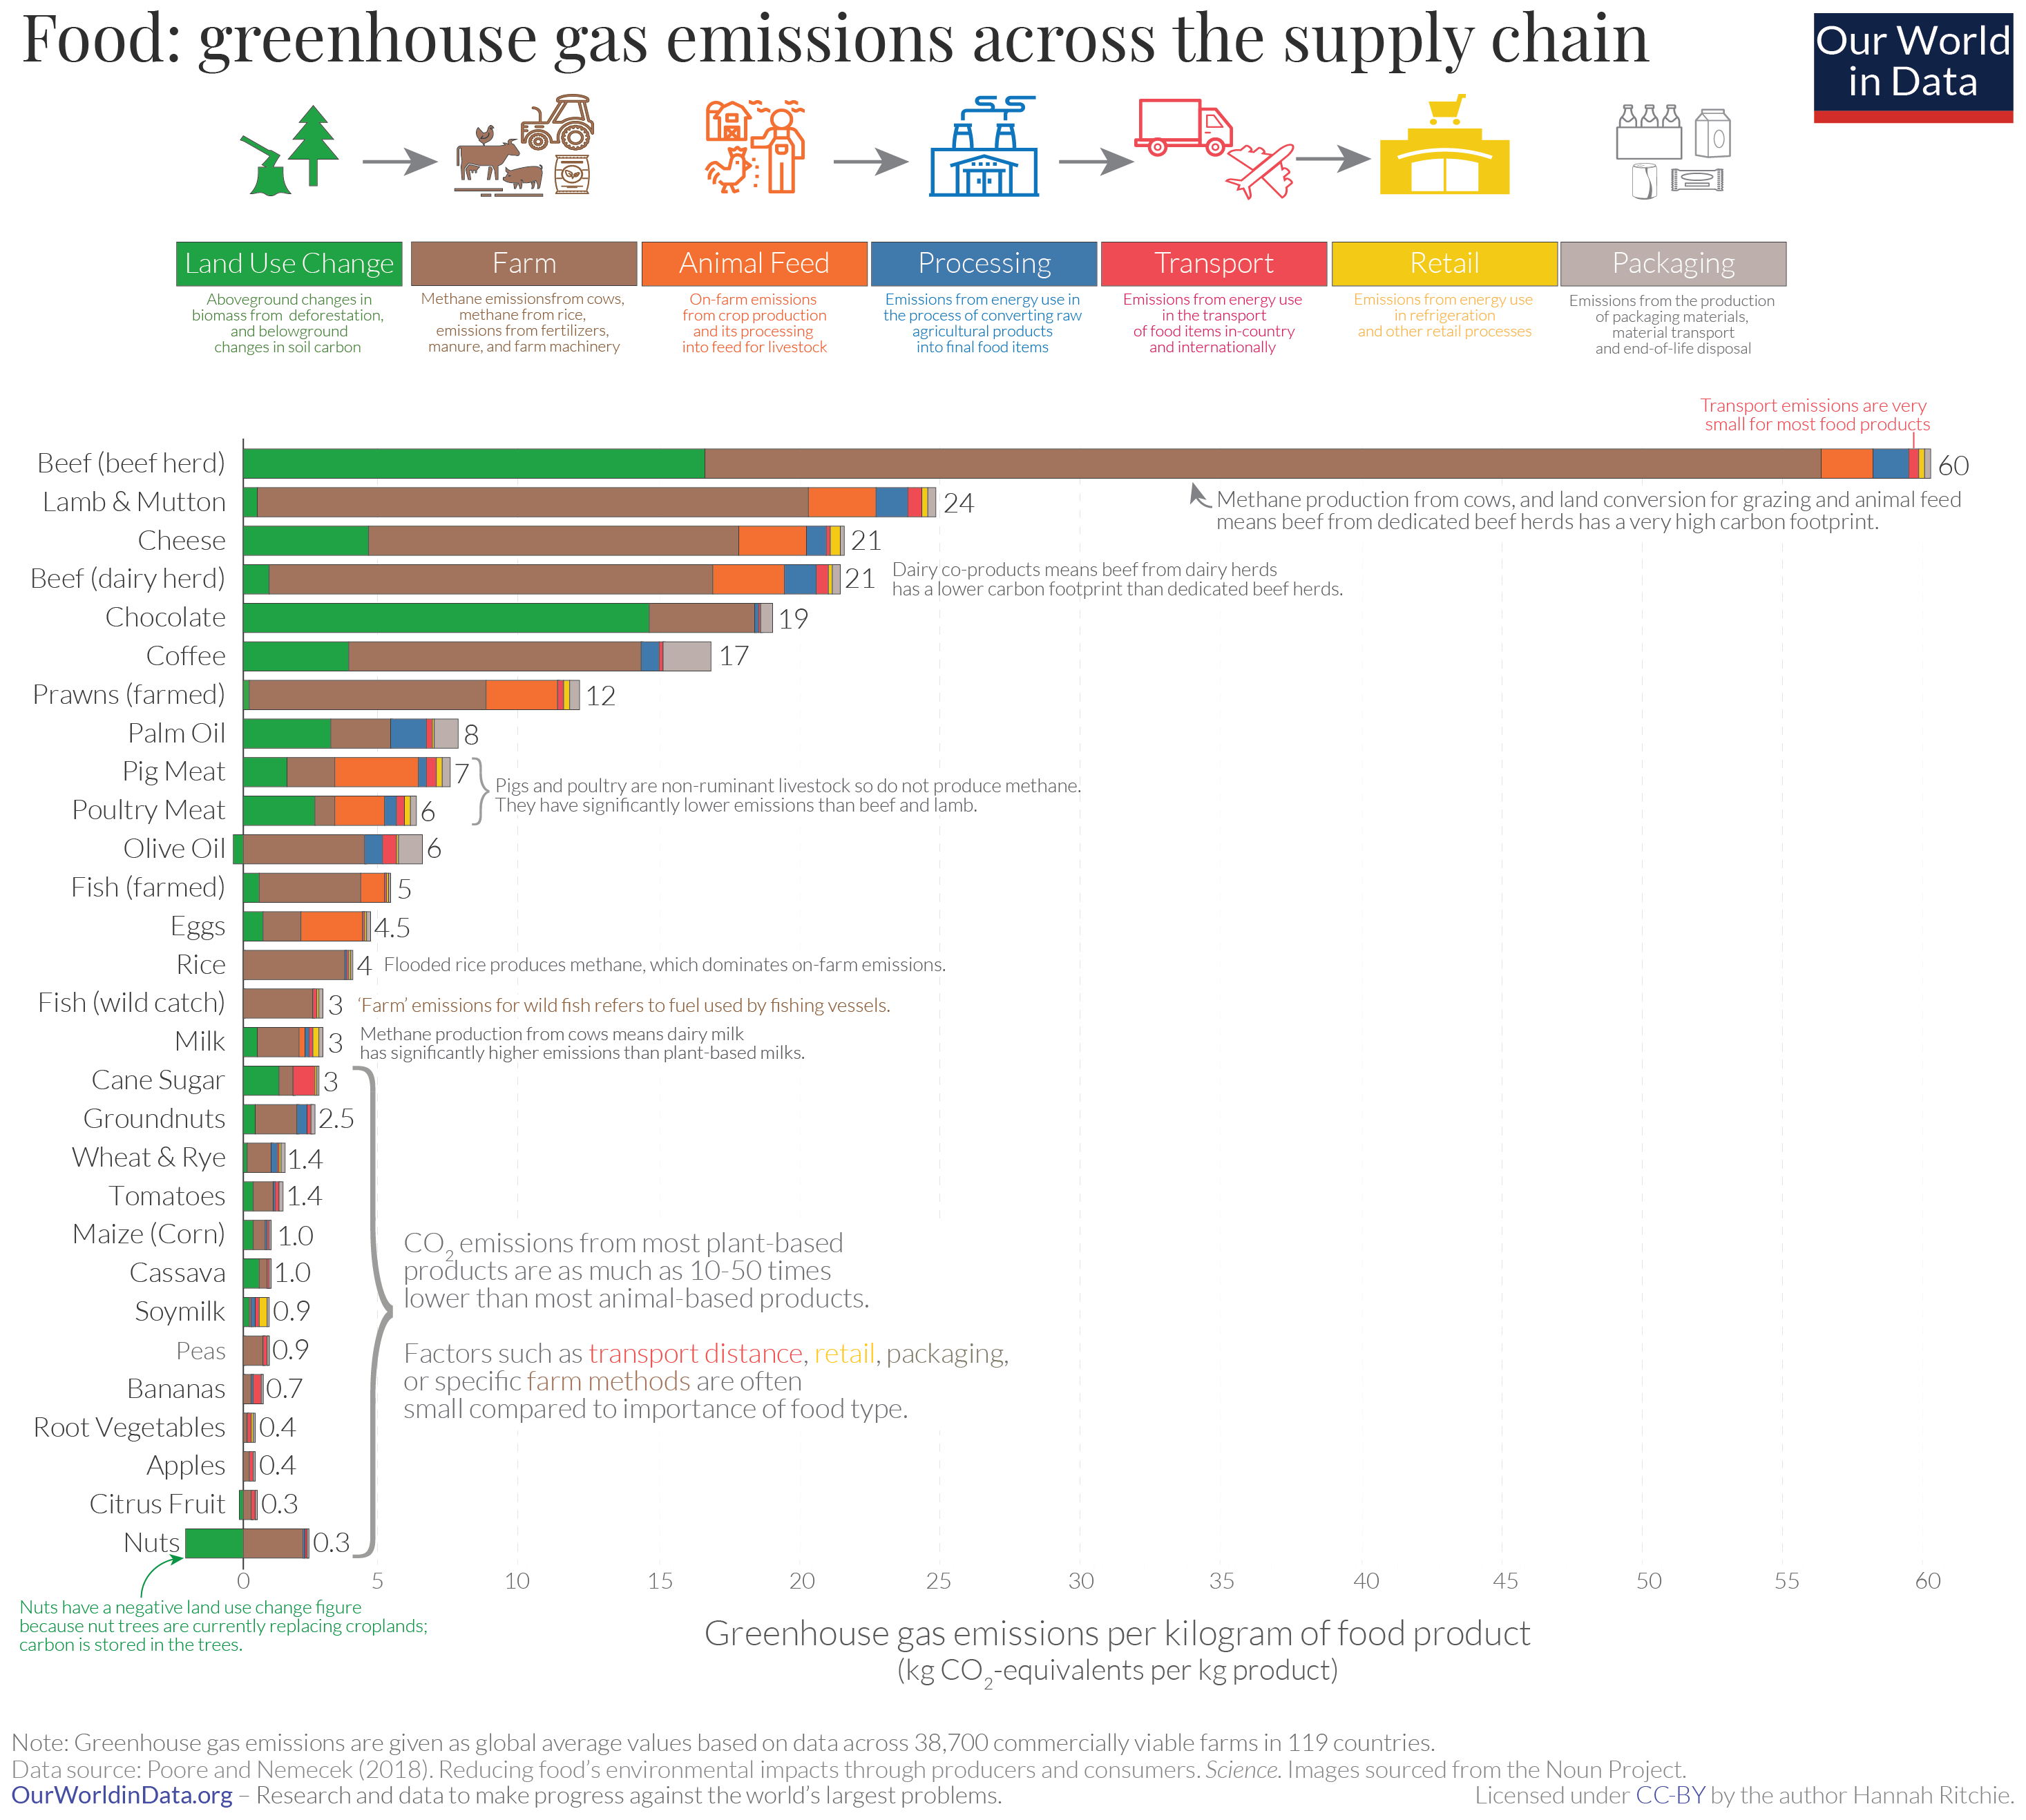
What’s the impact of the worst foods? According to this study (pictured above), the worst offender is beef, with around 60 kg CO2e of emissions per kg of beef produced. Which means:
- Eating 17 kg of beef emits one ton of CO2e. That’s around 80 steaks of 200g, e.g., about two steaks per week.
Heating and construction
Heating and hot water production is often done by burning fossil fuels (as opposed to solar energy or heat pumps), so they also contribute to your carbon footprint. The details really depend on the specifics of your housing situation, but to give an idea, the French standards for this estimate that a high-footprint home emits over 80 kg CO2e per year and square meter, and a low footprint one emits under 5 kg CO2e per year and square meter (see source in French), so there is lots of variability. The UK average for heating is 2.3 tonnes of CO2 per year as of 2014.
Another factor to consider is construction. Building a new two-floor, two-bedroom house was estimated to correspond to 80 tons of CO2e. This is a one-time cost, so it must be accounted over the entire lifetime of the building, but it is not negligible. This is related to the considerable carbon footprint of cement production, which accounts for 8% of the world’s emissions
Electricity
Electricity consumption is easy to account for: the total (in kilowatt-hours) is part of your electricity bill. The breakdown depends on which equipment you are using, and how long; you can estimate the consumption of each appliance using, e.g., a plug-in electricity meter.
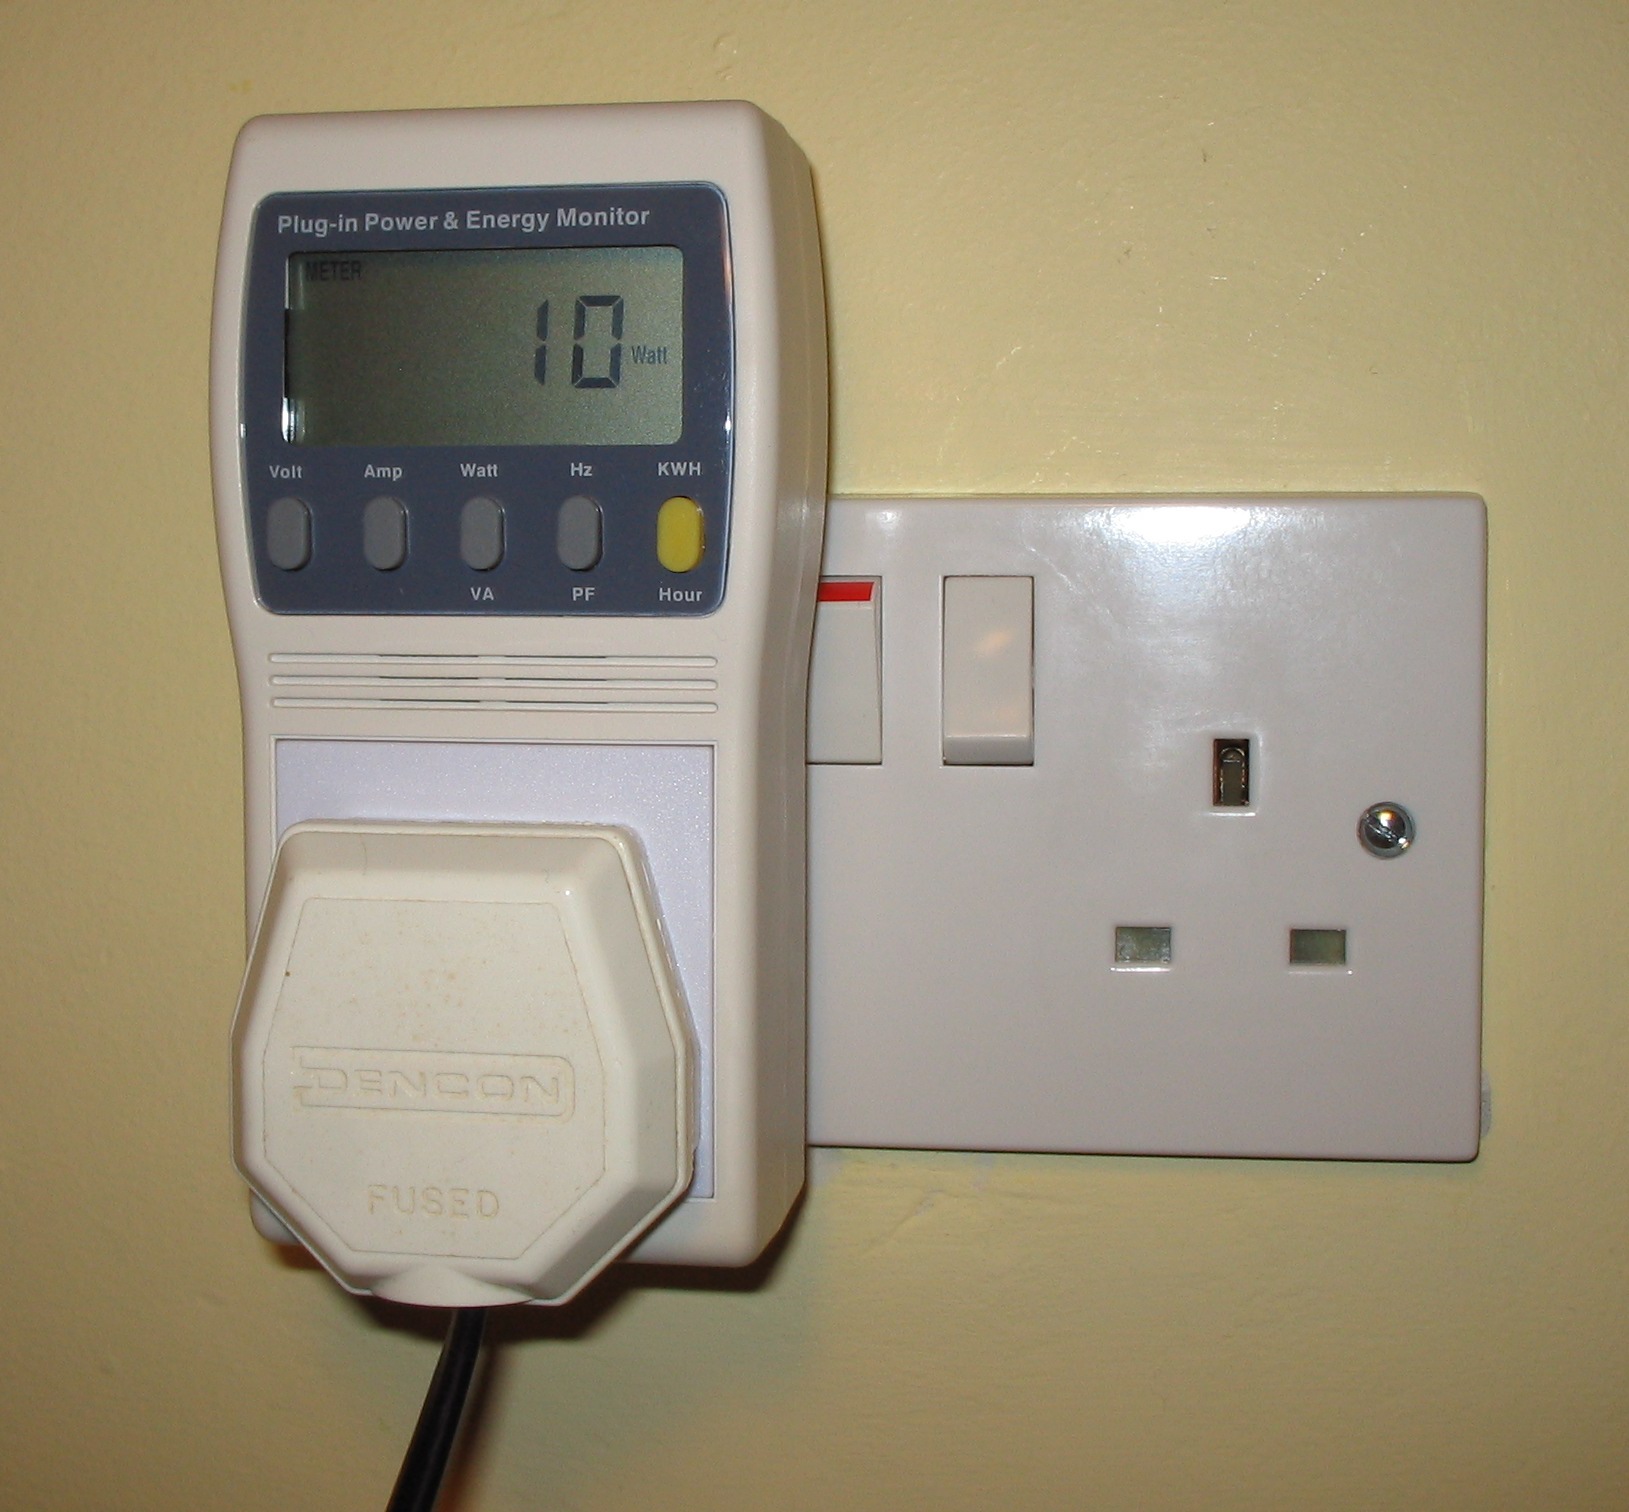
However, the carbon footprint of the electricity that you consume depends on how it is produced. The variation, according to the 2014 IPCC report as summarized on Wikipedia, is almost 100-fold: from almost one kilogram of CO2e per kilowatt-hour with coal, to 10 grams for wind power and nuclear power. These figures also account for indirect emissions, e.g., taking into account the life cycle of power plants, and surprising effects such as methane emissions from hydroelectric dam reservoirs.
To have some idea of where your electricity is produced, you can look at the IEA statistics. This varies a lot by countries, e.g., Norway relies exclusively on hydroelectric power and other renewable energies, France predominantly relies on nuclear energy, and China on coal but with a growing part of hydroelectric energy. You can also visualize the energy mix of countries using electricityMap. Of course, even in one given place, the concrete footprint of consuming a kilowatt-hour will depend on when it is drawn, i.e., at peak hours or off-peak hours, because this can have an influence on which kind of electricity is used.
So, taking an average of 429 gCOe per kilowatt-hour from here, we obtain that:
- Consuming 2,300 kilowatt-hours emits one ton of CO2e
- This amounts to a daily consumption of 6.4 kilowatt-hours, or around 266 watts of continuous power
Let’s focus on what this means more specifically for computing devices.
Computers
In the specific case of computers, the consumption varies a lot across device types. The best way to know them is to measure them with an electricity meter, or rely on measurements by the manufacturer, e.g., in the Apple sheets.
Laptops, which are energy-efficient to avoid draining their battery, generally consume less than desktop computers: around 60 watts on average, or as little than 10 watts when idle or less than 1 watt when in standby (suspend to RAM). So:
- Using a laptop for 38k hours, or having 4 laptops in use constantly during one year, emits one ton of CO2e
Desktop computers are typically less optimized, and can consume over 100 watts when in use (for the computer) plus an extra 50 watts for the screen, and possibly more for other peripherals. So:
- Having 2 desktop computers in use constantly during one year, emits one ton of CO2e
The same figures are roughly true for servers; see here for a writeup with more details. The rough estimate is that one CPU-hour consumes around 100 watt-hours, i.e., 0.1 kilowatt-hour. This is something to keep in mind when looking at large computations, e.g., the recent factorization of RSA-250 took around 2,700 core-years, i.e., 24M core-days, an estimated 2.4 terawatt-hour. So, in a somewhat tongue-in-cheek way:
- Factoring the 250-digit base-10 number RSA-250 emitted around one kiloton of CO2e

Of course, ARM low-power computers consume far less (also because they are computationally less powerful): a Raspberry Pi typically consumes around 5 watts.
Network and datacenters
When estimating the carbon footprint of your computer use, you may want to include indirect consumptions that are not directly paid by you (or are paid indirectly via your Internet subscription). This is the consumption of transferring data on the network, and the consumption of cloud services that you are using.
For the transmission of data on the Internet, a 2018 study roughly estimates a consumption of 0.1 kilowatt-hour per transferred gigabyte. According to the 429 gCO2e per kilowatt-hour estimate from above, this means:
- Transferring 23 TB, or about 60 GB per day, emits around one ton of CO2e
These figures are high for typical household Internet usage, but not so high for servers with high traffic, for some automated processes like backups, or simply for large downloads. These figures are for home Internet access – for mobile Internet over 4G networks, the energy consumption of data transfer could be a few times higher.
Using these figures gives us some insight about the environmental impact of videoconferencing. For instance, Zoom require up to 1.5 Mbps bandwidth for video calls (both ways), with similar figures from Skype. This means a bandwidth use of around 1.35 gigabytes per hour of call, i.e., around 58 grams of CO2e per hour. Thus:
- Doing 17,000 hours of videoconferencing, i.e., 2 continuous years, emits around one ton of CO2e
This figure only accounts for data transfer, not for the impact of running your computer for that duration, or the impact of the datacenters used to relay your calls. The footprint also depends on which videoconferencing software you are using: cf this comparison (in French). Still, it is interesting to compare it to the footprint of traditional conference travel, where each attendee can easily fly 4h30 and emit one ton of CO2e for just a few days of talks.
The environmental impact of video streaming services has also been estimated:
- For Netflix: it was estimated here (see competing older figures here and here) that watching Netflix releases about 36 grams of CO2e per hour, so watching 28,000 hours of Netflix (i.e., more than three continuous years) emits around one ton of CO2e
- For Youtube, the yearly emissions of Youtube for the year 2016 were estimated to 10 million tons of CO2e, whereas Youtube viewers watch around 1 billion hours of video a day. This works out to around 27 grams of CO2 per hour watched, i.e., the same rough order of magnitude
Cryptocurrencies
Cryptocurrencies have been under scrutiny for their environmental footprint, with reason. The most famous cryptocurrency, Bitcoin, has an impact that has been estimated to around 20 million tons of CO2e for the year 2018 (i.e., about two times Youtube’s estimated consumption); the IEA’s estimation is of 10-20 million tons of CO2. There is around one bitcoin block every 10 minutes, so around 50k blocks per year. Hence, using the higher figure:
- Producing one block of the Bitcoin blockchain emits around 400 tons of CO2e

This is rather high for the service that bitcoin is providing, because they are only around 300k Bitcoin transactions per day as of this writing, so around 100 million per year, compared, e.g., to the hundreds of billions of hours of video watched on Youtube. So another way to put it is:
- Performing 5 transactions on the Bitcoin network emits around one ton of CO2e
As Bitcoin allows batching of multiple transactions into one single transaction, a better measure may be to look at the number of outputs per day. This is about 900k per day as of this writing. Thus, if your transaction is batched with others, expect its carbon footprint to be smaller by a factor of about 3.
There are other statistics here. Data for other cryptocurrencies are harder to come by. For the second largest cryptocurrency, Ethereum, the energy consumption is estimated to be about 1/10th of that of Bitcoin.
There are also alternative ways to design blockchains that try to reduce their carbon footprint, for instance replacing the computational proof of work system by alternative mechanisms such as proof of stake.
Production of goods
The production of consumer goods also causes CO2e emissions, which are challenging to estimate. Sources for information on this include manufacturer-provided information in the form of Product Carbon Footprint (PCF) sheets (typically following the PAIA methodology from MIT), e.g. the PCF sheets from Dell, Lenovo, or Apple; or independent studies such as the study by Belkhir and Elmeligi in the Journal of Cleaner Production, available here. Based on these sources, roughly:
- Producing a smartphone emits around 80 kg CO2e, so producing 13 smartphones emits around one ton of CO2e
- Producing a laptop emits around 200 kg CO2e, so producing 5 laptops emits around one ton of CO2e
- Producing an LCD screen emits around 100 kg CO2e, and producing a desktop computer emits around 300 kg CO2e, so producing two complete desktop computers emits around one ton of CO2e
Figures can be found for other goods too. For instance, producing a T-shirt emits around 7 kg CO2e according to this report (and washing it 50 times over its lifetime is estimated to emit around 8 kg CO2e), so with a one ton of CO2e you can buy 150 t-shirts. By contrast, producing a car and recycling it will emit between 6 and 10 tons of CO2e according to this Greenpeace report, and this is less than a quarter of its total estimated carbon footprint.
Waste elimination
Throwing non-recyclable waste away also generates greenhouse gas emissions related to the processing of the waste. Estimates from the EEA indicate that landfilling is the option with the highest impact, emitting a mass of CO2e which is greater than the mass of waste processed. By contrast, other options have a negative footprint, e.g., incineration, which generates energy and can help reduce emissions in other areas. The average in Europe in 2008 according to these estimates was at 400 kg CO2e per ton of waste, so:
- Throwing away 2.5 tons of waste emits one ton of CO2e
The European average is around 500 kg of municipal waste per year per inhabitant, i.e., 200 kg CO2e.
Recycling, on the other hand, has a negative carbon footprint: while it causes greenhouse carbon emissions, they are offset by the savings in production costs that are avoided for the recycled material. This is covered in a study summarized here. For instance, recycling aluminum saves 8 tons of CO2e per ton of recycled material.
In conclusion
I hope that this article gives you a better picture of what a ton of CO2e represents. The important point is to estimate how much of your carbon footprint goes to these various areas, and how to make the right savings. For instance, there is little point worrying about the carbon impact of your food if you are making multiple round-the-world plane trips every year; and the footprint of a small home server such as a Raspberry Pi is probably much less, e.g., than the carbon emissions of heating your home. And again, this should be done while keeping in mind that many important environmental issues cannot be neatly counted in terms of equivalent carbon dioxide masses…